How to efficiently review and classify data from your account analysis statements from both international and domestic providers
Bridget Meyer, Senior Director at Redbridge, recently chaired a panel for the Association for Financial Professionals (AFP) 2020 Virtual Experience. Guests Dennis Humble, assistant treasurer at Humana; Darrilyn Lawrence, treasury consultant at Lincoln Financial Group; and Angie Grunte, Senior Director at Redbridge, discussed their experience and recommendations to cope with the massive data encountered in merchant and bank fee statements. This article summarizes key concepts and takeaways from that session.
To download the session slides, please scroll to the end of the article.
This is part one in a two-part series. Read part two here:
What is an account analysis statement?
In the U.S., an account analysis statement is a bill for services rendered by your bank. The statements are a record of your account balances and the bank’s services. They summarize your treasury operations — everything your team does across the globe. The statements are an excellent data source, including information about your earnings credit rate (ECR) and how it affects your fees.
Statement analysis is typically the last task to be completed each month — if done at all. The process is tedious, confusing, and involves a lot of data with terminology treasury analysts do not understand. It is always a bit shocking that the youngest individuals on a treasury team typically approve the analysis statements every month since the fees can be millions of dollars from a major vendor. In no other part of the business do analysts have this much “power.”
Statement formats
Generally, the bank’s statements are available as PDFs downloaded from your online banking portal. Some banks include the six-digit AFP Service Codes© in the statements, but not all. In the latter cases, the corporate treasury team must fill in the blanks since service codes are crucial to cross-bank comparisons and analytics.
Additional statement formats include EDI 822, TWIST, camt.086, and a BSB statement. Anyone considering a bank fee project in the future should talk to their banks now about using one of these machine-readable, electronic formats — even though the banks may have to configure their systems to comply. Requesting these formats ahead of a new project is essential because banks cannot reconfigure old data into a new format.
-
Pro Tip: If you’re planning to start a bank fee project six months from now, ask your banks to set you up for the abovementioned statements now so that they can go back and give you everything in a simple electronic format when the time comes.
Standard components of statements
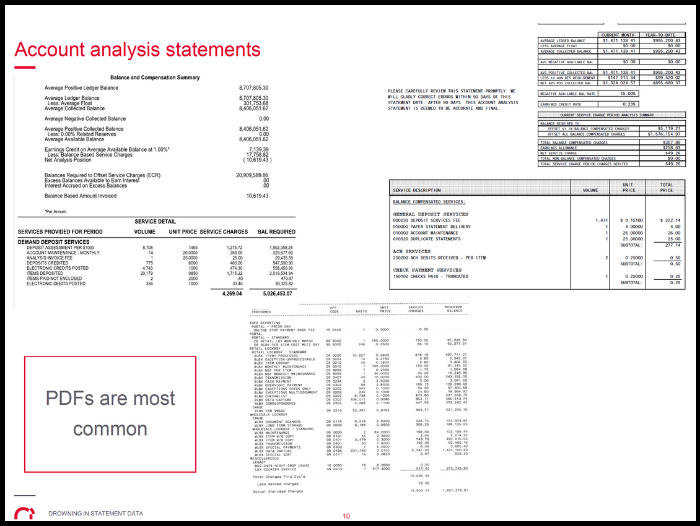
Bank fee statements have standard components and follow a standard layout and flow. Typically, account balances, compensation information, and net fees due are located at the top of the statement, and a list of your services at the bottom (Exhibit 1).
In two of the examples provided below, the banks provided AFP Service Codes within the statements. When you begin analysis and dive into the data, service codes are crucial.
Exhibit 1
Analysis statements always begin with balances — typically the average ledger balance (Exhibit 2). The amount of balances held in an analyzed checking account play a key role in offsetting service fees.
The key takeaways on a statement are the investable balance (highlighted in blue) and your net fees due (also highlighted in blue). Banks use the investable balance to calculate earnings credit. Net fees due is the actual amount paid by a company for services rendered. These elements help you answer questions like, “How much cash should I leave in my account?” and, “How will that impact net fees?”
Exhibit 2
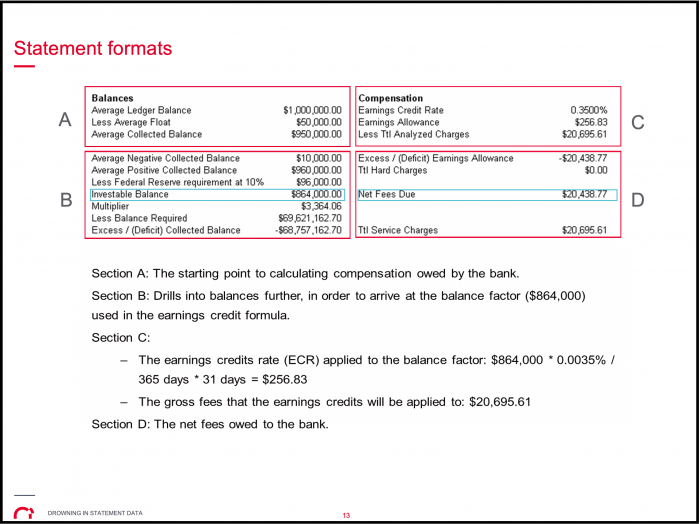
ECR appeared during the era before U.S. banks could pay interest to corporations for their credit balances. For this reason, investable balances are found in U.S. statements only (ECR never appears on international statements; however, some banks do offer a global ECR program).
-
Pro Tip: As a cash manager, you should highlight investable balances and net fees on your statements and track them over time. A timeline graph will show the relationship between the two.
While receiving data from banks is not generally an issue, understanding the data can be difficult. Fortunately, various software programs can read EDI822, camt.086, and CSV statements, making acquisition and analysis of the data relatively simple. Electronic options also exist on the international bank side, with more than 36 global banks regularly providing this data in 82 different countries.
How AFP codes can help you (even if your bank doesn’t use them)
The AFP Service Codes are designed to standardize language across banks to eliminate confusion about different bank services. A generic industry-standard naming convention and correct classification of each service enable consistent, timely, meaningful analysis. In 2020, the AFP taskforce completed an eight-week project of reviewing all 2,000+ active service codes and made the largest update to the code set to date, complete with updated language and new codes to recognize the diversity of payment channels and services.
-
Pro Tip: Many companies go years without realigning their service codes. Darrilyn Lawrence suggests companies regularly review their database for accuracy and ask banking partners if they properly align their bank services with the most current AFP service codes.
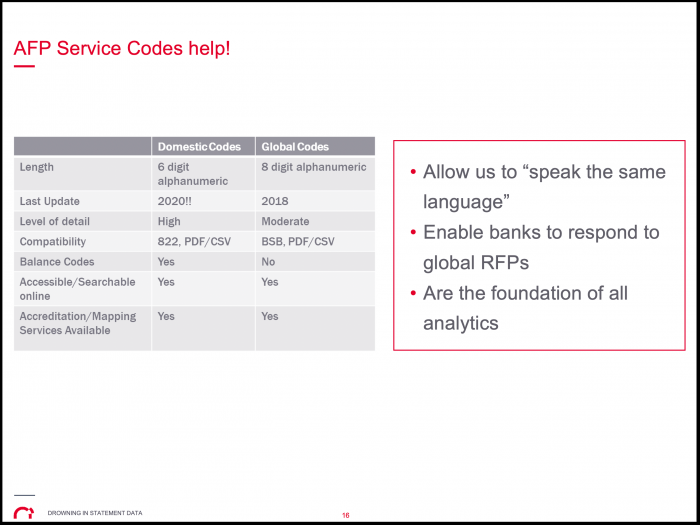
Even with new codes, differences between the global and domestic AFP code sets remain, complicating analysis and requiring a manual interpretation and transposition to match apples with apples. The following table (Exhibit 3) illustrates the significant differences.
Exhibit 3
For example, if a French bank sends you global AFP codes and a U.S. bank provides domestic codes, you need to manage the interpretation internally. Fortunately, AFP provides a translation table and, hopefully, your software can help you with the task as well. (If it can’t, ask us about HawkeyeBSB, which does this for you automatically.)
U.S. trend to bundle services
With the use of translatable codes, why are comparisons so tricky? Because banks do not accurately assign the codes and bundling is becoming more popular.
U.S. banks had previously used a strategy of disaggregating service lines and charging for each separated component. Consequently, a statement for one account might list 150 different services.
Currently, the trend in the U.S. is more packaging and more consolidation of service lines, reducing the need for multiple codes to make billing more straightforward and reduce costs.
Foreign banks move to disintegrated services
Conversely, banks outside of the U.S. are taking the opposite approach, disintegrating previously combined services under a single AFP code and redefining their services into 20, 50, 100, even 150 lines, each with a separate fee.
Even within the same global bank, the format and content of a statement could depend on your location. The same bank often uses different billing systems, causing formats and service names to differ from country to country. A simple service like debit or credit posting may be labeled differently in each location. For example, an “FTN posting charge” in the U.S. is identical to a “com ES&CHRG trans.” charge in Honduras (Exhibit 4). Without mapping, there is no way a treasurer could know that.
Exhibit 4
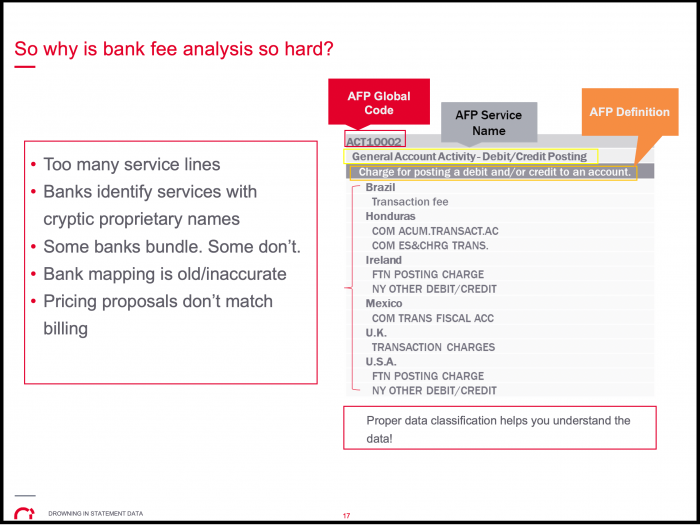
Since multiple definitions exist for the same service, analysis can be quite complicated.
AFP is at the forefront in efforts to resolve the classification problem, offering an accreditation program for banks whereby AFP will assign the mapping for them. This solution directly benefits the corporate audience and the banks because data classification is not just a one-time thing. Banks tend to change their billing practices annually, creating a never-ending corporate requirement to adjust classification.
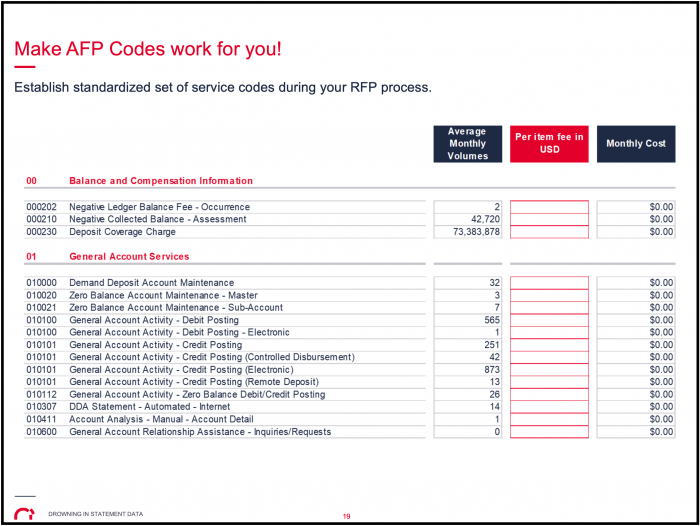
After the code’s proper assignment, anyone can produce a pivot report with data aligned by the correct AFP name and code. The exhibit below (Exhibit 5) illustrates the services’ total average volumes at the standard level across banks. The result can be used in an RFP or to answer, “How many of these wires do I send in a particular month?” Having the fields attributed to your data facilitates any analytics, modeling, or scenarios you want to run.
Exhibit 5
How Lincoln Financial Group improved its bank fee analysis
Panel member Darrilyn Lawrence shared Lincoln’s experience, recently completing an RFP and a merger and acquisition. According to Darrilyn, “Having our AFP codes properly aligned allowed us to simultaneously compile bank fee data and compare costs for the RFP and merger and acquisition. Having the data properly aligned was key to benchmarking the services for both projects and streamlining cost comparison.”
Darrilyn noted that companies often forego regular account analysis because it’s convenient to just pay the invoice each month or quarter-end. Through trial and error, Lincoln’s treasury unit learned that the account analysis function should be a required monthly process. Lincoln’s monthly process validates their pricing, volumes, and charges and ensures discrepancies are swiftly reconciled with the banks.
Lincoln’s bank fee process has evolved beyond validating invoices to using the data. “A well-maintained bank fee database is like a library that houses a wealth of information and that provides endless reporting opportunities by using the data within your bank fee system,” said Darrilyn.
Lincoln has learned that reviewing volume trends and cost metrics with business units creates cost-saving opportunities. When a business unit understands the all-in cost for a check, wire, or ACH in relation to their payment volumes, it allows the business unit to streamline its payment methods.
Lincoln also utilizes its bank fee data in reports to provide strategic direction to the cash management and corporate treasury teams. The reports provide account balances, earnings credit, and FDIC rates used to benchmark and strategize the company’s best investment opportunities.
Before the 2008 financial crisis, earnings credit rates ranged between 4% and 5% and helped reduce bank fee costs. Today’s economic environment has changed considerably, and ECR is significantly lower, which has increased bank fee budgets and affected investment strategies. Now, more than ever, analyzing bank fees should be a crucial part of corporate treasury’s function to ensure companies are capturing their greatest earnings and cost-saving opportunities.
Lincoln Financial Group continues to analyze and utilize its data to find cost savings and streamline payments. According to Darrilyn, “It all begins by using the data we have in our bank fee system.”
How Humana improved its bank fee analysis
Panel member Dennis Humble noted that Humana worked with a third party—Redbridge—to help the enormous health care organization better understand its bank fees and execute the account analyses to determine redundant services. Humana has a small treasury department with thousands of bank accounts and millions of dollars in fees to be managed. Even though the company’s banks are under contracts that lock the pricing, many other things need review.
Following an extensive collection of data, Humana compartmentalized and analyzed its banking services by each bank and each service, allowing its treasury team to benchmark against the market for its size and volume. They subsequently leveraged the data to negotiate lower pricing, then re-contracted with the banks, extending their contracts for a few years. The exercise was valuable and produced many savings. The deep dive into the data made Humana’s success possible.
Humana considered several scenarios and considered moving their accounts to a different bank to capture significant savings or a great product or service that it could implement. However, before making a decision of that magnitude, Dennis advises treasurers to look in detail at the impact on other internal users of the data and consider the cost of implementing a change.
Like Humana, more companies today measure IT development costs and include the charges in a cost-benefit equation: if a change does not drive net value return on capital, the company will not do it. Many companies have that sort of rigor built into their systems now.
Humana considered several potential projects that didn’t make the cut because the internal costs were too expensive, or the change would disrupt the chain of banking services it needed. Having a reconciliation perspective, an IT perspective, and a communication and testing perspective should be considered before implementing any significant change you might consider for banking services.
-
Pro Tip: Pay attention to each service and affiliated relationships. Quantifying projected results and knowing your internal customers is crucial to determine if a change is warranted.
“After many years in treasury, I’ve learned from my failures and my successes, too,” said Dennis. “Remember that failures can provide useful information to learn and apply.”
Conclusion
Treasury departments are asked to make strategic recommendations based on data that is confusing and overwhelming. This article aims to help treasury teams efficiently review and classify data from their bank fee statements and turn it into meaningful reports that aid organizational decision-making. In part two, we’ll dig into how you can do this with your merchant card statements.
DOWNLOAD SLIDES FROM THE SESSION