Banks utilize RAROC (risk adjusted return on capital), a risk-based profitability measurement, to assess the efficiency of their business relationships with corporations. Similarly, savvy treasurers use the tool to monitor costs and ensure competitive pricing in their banking relationships.
The range of products and services offered by banks are evolving and their costs are increasing as treasurers’ needs broaden, regulations become more burdensome, and markets become more sophisticated. As a result, corporate treasurers are facing less transparency in increasingly complex relationships with their banks.
The question that banks and corporations face is what is an appropriate level of expenses paid and income earned for a mutually beneficial relationship to exist?
Banks, in exchange for providing corporations credit lines, seek “side business” to help compensate for accepting credit risk. “Side business” covers a range of products and services, including cash management, market operations, coverage rates, and exchange rates. Such a system creates uncertainty surrounding the fair value of the services provided to corporations for two primary reasons:
- In the absence of a benchmark, companies often believe they are obtaining optimal pricing. However, without the guidance of an advisor with a database of best prices for similar companies (i.e., industry, rating, size, etc.), a company will never be certain where it stands relative to comparable organizations. Companies frequently pay fees for unnecessary services or, conversely, unwittingly expose themselves to disengagement risk if a bank believes it is not earning a sufficient overall return relative to risk.
- Because banks position “side business” as the additional compensation corporations must pay to justify the bank’s open credit risk exposure, the calculation to determine sufficient return is complex. In other words, to quantify a mutually beneficial banking relationship, the final output for return must be computed by accurately pricing the individual variables of credit exposure and products and services, among other variables. To add an additional level of complexity, each bank utilizes its own internal model with different prices for the variables. This means banks will always measure and define an acceptable rate of risk adjusted return differently than their peers!
Superior profitability to weighted average cost of capital (WACC)
Since most banks measure their efficiency through a RAROC model, it is important to understand its evolution.
Arising out of economic theories from the 1970s, the formula optimizes the allocation of bank capital by determining an appropriate measure of risk-adjusted return. Banks, like any other business, seek to generate a superior risk adjusted return to their WACC. Generally, the cost of capital is around 10% and profit targets between 10% and 15%. To achieve this goal, the banks have the ability to adapt their selling prices, lower costs or change the allocation of capital (i.e., their commitments to a single prime contractor).
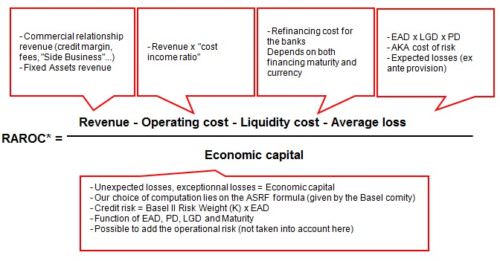
The image below illustrates the formula used to calculate RAROC.
Treasurers should periodically engage an outside advisor to formally measure the corporation’s RAROC with each of its banks to ensure accurate benchmarking of services and fees to comparable organizations.
Corporations with existing models must also periodically recalibrate their models.
An engagement for analysis can be performed over the life of a banking relationship or for a set period. Results may take up to several months to accurately calculate, dependent upon the scope of the operation.
It is also essential to note that an accurate RAROC analysis requires knowledge of each bank’s preferred range of parameters for different inputs. Such understanding is acquired only over years of working with banks across industries, credit ratings, and sizes.
Model parameters
To determine a fair profit margin for banks, a corporation must first know the income it generates and the bank’s costs it incurs.
The income corresponds to the fees and commissions paid, all of which are likely to evolve over time and establish variability in the profitability of the relationship. The costs are mainly comprised of operating expenses, which are possible to model using traditional ratios (i.e., cost income ratio, etc.) but must be calculated to accurately reflect the average cost of each type of observable transaction in the banking industry.
Additionally, taxes and liquidity costs accounted for 200bps of widening during the financial crisis and had a material impact on the profitability of banking transactions. These costs have since fallen back to a historical low range between 10 and 60bps, partly due to the implementation of Basel III liquidity ratios (LCR and NSFR).
Aside from the operating costs, banks bear the cost of risk inherent to each transaction.
The cost of risk is expressed through the average loss and by providing internal capital. The average loss is defined as the product between the exposure of the bank at default (EAD), the rate of loss given default (LGD), and the probability of default attributed to the borrower (PD) by the lender. These same parameters are used with the residual maturity in order to set the amount of economic capital.
Notably, each bank takes a different approach to establish an internal rating of a company. There are two primary methodologies utilized:
- A bank may opt to use the LGD and other parameters provided by the IRB Foundation.
- Or, a bank may use the Advanced IRB method in which the bank may develop its own internal empirical model to quantify the requisite capital for credit risk.
The probability of default is derived from the rating of the borrower.
The rating scales used by banks and the corresponding default probabilities are typically available in the bank reports. However, a default probability, even for a “risk-free” asset, is never zero and the PD is particularly sensitive along the border between investment grade and high-yield. As a result, the latter leads to large disparities in financing terms offered by different banks to a single borrower, which create opportunities for astute treasurers to persuade lenders outside the market to meet their internal rating. To utilize this strategy, the treasurer must capitalize upon the differences between the rating criteria used by the banks and those used by rating agencies.
Tools by which to navigate
The relationship between income generating bank services and the risks inherent in providing such services will affect RAROC levels. In other words, unsecured funding is often the least profitable for banks given the level of risk. In contrast, other services such as bond issuances and asset management generate minimal risk and provide high relative rates of return.
By accurately tracking the rates of return generated by each banking relationships, corporations will possess a tool that will enable them to assess, control, and monitor the value of their banking relationships.
Wherever RAROC can uncover sources of savings, such as in unnecessarily high credit lines, superfluous services, excessive fees, or abnormally high rates of return, treasurers will possess the tools and information to equalize the balance of power in future negotiations.
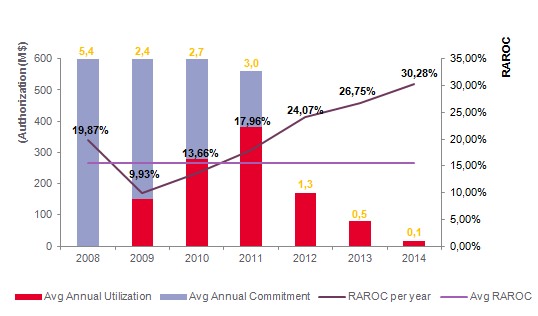
Example of RAROC for a five-year amortizing bank loan
Data derived from use of RAROC