There is still appetite for highly-rated corporates, but the size of financing must be consistent with a company’s business plan. Since last summer, credit committees have been becoming increasingly cautious and this trends looks set to continue, writes Muriel Nahmias.

At the beginning of 2020, companies still had ample access to banking liquidity, but the resurgence of geopolitical tensions and contingencies such as coronavirus outbreak may put an end to narrow credit spreads.

The macroeconomic outlook based on a soft landing in Europe and the Federal Reserve taking action to support the US economy, encouraged companies to raise funds in 2019, in anticipation of external growth. Fast-growing SMEs in particular revisited their financing structures, resulting in transactions to support future growth and investments, which typically included setting up their first syndicated loans and diversifying their financing sources to the likes of bond debt and / or commercial paper.

But this situation has changed. Lenders have started to distinguish between investment-grade borrowers and high-yield firms, which are deemed to have a greater risk. Having emerged in the United States, this trend looks set to continue.

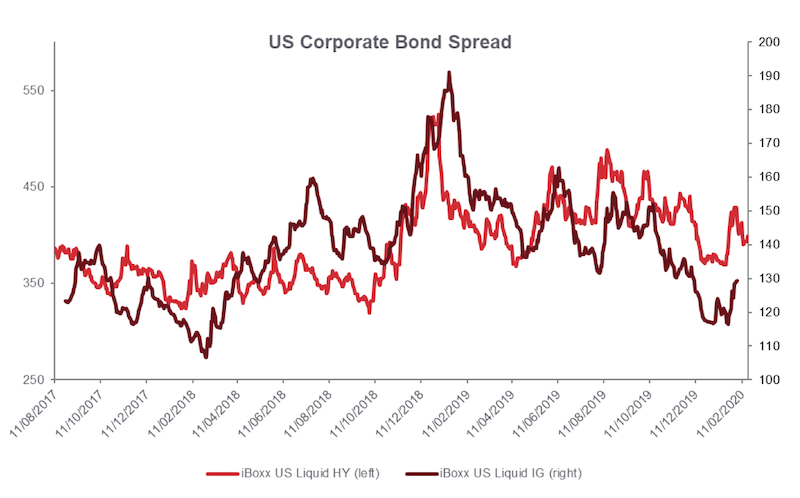
Banks and investors are focusing on their top-rated clients, which are therefore benefiting from a sort of flight to quality, while there is a more mixed attitude towards crossover or sub-investment-grade corporates. In fact, the terms and conditions offered to non-investment-grade borrowers has been seen to worsen in the most recent bank loan and private placement transactions.

In an environment in which credit committees have adopted a more cautious stance, corporate CFOs should ensure that they have an attractive story to tell and be able to demonstrate a good level of cash flow generation to service the debt and eventually repay it.

For companies falling short of these requirements, the concept of ample liquidity is just an illusion. The temptation to obtain more financing than necessary can lead to significant carrying costs. Credit committees and coverage teams are paying close attention to the size of existing facilities and are seeking to downsize them. There is still an appetite for high-rated corporates, but the size of financing must be consistent with the company’s business plan. This is a first step toward normalization of credit conditions.

Olivier Grandval, treasurer at Louis Dreyfus Company, discusses how SWIFT gpi simplifies the daily work of the treasury team of his group that trades in agricultural commodities. For him, improving the traceability of cross-border payments opens up new opportunities for bank relations and cash flow forecasts.

– How long have you been issuing SWIFT gpi cross-border payments? What are the advantages of doing so?

– Louis Dreyfus Company’s treasury has been issuing SWIFT gpi payments since January 2019. This service meets our dual requirements of traceability and speed of payment. Louis Dreyfus Company operates in an industry that requires a lot of transparency and responsiveness. Every day, as part of our agricultural commodities trading activities we issue very large payments in almost every country in the world. A payment that is not received could result in a vessel not sailing. The financial consequences can be significant!

We also spend a lot of time reassuring our suppliers that funds will arrive soon. The traditional method is to ask our banks for MT103 messages proving that we have made the payment. Not only is the SWIFT gpi process faster, it also simplifies this way of operating. We have the ability to track each payment based on the UETR (unique end-to-end reference) and know where the funds are in real time. We can also share this reference with the beneficiary. In the end, we are able to provide more information than with a MT103, which is the benchmark in our business, and this gives our counterparties more confidence.

– How did you launch the service?

– At the end of 2018, we were asked by one of our banks to become one of the first users of SWIFT gpi. In two months, our vendor was able to work with SWIFT and provide the support to deliver the ability to generate and track UETRs in our treasury/banking communication tool.

Currently, only our EMEA regional team issues SWIFT gpi payments, which are mainly in U.S. dollars. We will soon have a second bank using the service, with a third following early in 2020.

– What have you learned about the payment process so far?

– SWIFT gpi enables us to see the bank routing used by our payments. Previously, it was a mystery which network of correspondent banks was being used to route a payment. Now we know which routing our bank uses from France to the destination of our payment. We also know if our bank will use the most common, the most traceable or the lowest cost routing for a given destination country! Businesses cannot choose which correspondent banks, their remitting bank uses. However, SWIFT gpi’s transparency will increase pressure on banks to use the best correspondent networks for cross-corder payments. This transparency will enable us over time to compare the correspondent bank used and the costs charged by them for the same destination. We can then channel them through the most efficient and cost effective networks.

– How do you monitor the progress of your SWIFT gpi transfers?

– We take an industrial approach to cross border payments. We would not have been candidates for SWIFT gpi if we had to connect to our bank’s on-line banking systems to track the progress of each payment. They are issued directly from our treasury system that retrieves all the information downstream of the issuance.

We have already issued more than 10,000 gpi payments. We can see the number of gpi payments issued per bank, per currency and per status (credited, rejected, etc.). However, we do not yet have the appropriate reporting tools to exploit information on the fees and gpi connectivity of the routing (that is, all the banks involved in the payment chain). We need an effective system for reporting the explicit costs charged at each step of the transaction, from issue to receipt, including the costs charged by the correspondent banks. This system also needs to report on the implicit costs generated, for example, when a a payment is converted into an account that is not in the currency of the payment. We are also interested in the type of fees. We see that some correspondent banks are changing the charging instructions from OUR to SHARE.

Having such reports will be a second phase of the project and it will take time to build a fully-fledged tool capable of reporting these issues and providing analysis to management.

– Other than reporting, what future developments do you expect with SWIFT gpi?

– We are very interested in the order pre-validation API, which will enable us to reduce returns and rejections on our payments. However, this API requires an update of our banking communication tool.

We are also working with our vendor to receive advance information on incoming payments so we can integrate them in our forecasts. This service, called gpi inbound, will be available to pilot from early 2020.

When we think about how bank fees are being treated in the U.S., there is something very unique that, regardless of your company’s size, industry or banking partners, if you operate in this country, your bank fees will inevitably be tied to your operating balances through an earnings credit rate (ECR) mechanism.

You have probably been told that, for better or for worse, the fate of your ECR depends solely on the evolution of the fed funds rate. But is it really so? And does it mean that with the current downward rate environment, your only option would be to gracefully accept that your ECR will go down? Before we address this, let’s take a look at the past and understand how we ended up asking ourselves these questions.

When it comes to the fed funds rate evolution, you can essentially divide the last decade into two major eras.

First era: 2009-2015

From 2009 to 2015, the fed funds rate was steadily and consistently nearing zero after a huge collapse throughout the prior years. During this first era, companies started to diversify their investment and sought alternative options to generate better yield on their operating balances. Because the rates were so low for so long, everybody forgot about ECRs and adjusted to the new reality of paying gross bank fees.

Second era: 2015 to present

Late in 2015, the wind began to change, and the fed funds rate finally came out of hibernation and started rising again. The upward trend was steep and steady, and by early 2019, the fed funds rate peaked at 2.5%. The rest of the year has been a little rocky, as we are now experiencing a downward trend again.

Redbridge clients’ ECR vs. the fed funds rate

We looked at data from the last 18 months, where we actually experienced the rates rising, peaking, and decreasing, and analyzed a panel of Redbridge clients. What we found contradicted two of the most widespread assumptions in the industry: ECR and fed funds rate are strictly tied together, and there is almost no room for negotiation in this downward rate environment.

Graph showing redbridge clients' ecr evolution vs fed fund rate

We randomly selected 27 large corporations within the same range of balances to provide a representative panel of companies in every industry and vertical.

The first observation from our study is how wide the range of ECR is among the sample. Over the 18-month period, the average spread between the lowest ECR and the highest ECR of the panel was 123 basis points (bps).

But certainly, the most important observation is the difference between the evolution of the fed funds rate and the evolution of the average ECR in our sample. Although both rates tend to follow the same upward or downward pattern, there is no absolute correlation between the two rates. And the truth is the fed funds rate has been rising at a faster pace, when the average ECR has been struggling to catch up, especially during periods of frequent fed funds rate increases.

From May to December 2018, the fed funds rate increased five times, but the spread between the average ECR went from 122 bps to a record 183 bps. Only after the fed funds rate started to plateau in the first semester of 2019 did the spread start to very slowly and marginally close. But even after two decreases in rates in the second semester, the spread between ECR and fed funds rate still hasn’t come down to the lowest point of 122 bps that we observed in May 2018.

Monitor your ECR

So, I think you all know what I am getting at: even though the rates are going down, there is still ample room for negotiating your ECR to not only catch up with the Fed, but significantly and sustainably reduce the gap. The average spread between ECR and fed funds rate among our sample over the 18-month period was 156 bps. I would argue that after the next Fed meeting on December 10, 2019, even if the rate decreases again, there would still be room to negotiate.

Reactivity and consistency are critical factors for success. If you are a large corporation paying significant bank fees and keeping a substantial balance, dropping the ball on your ECR for only a couple of months could cost your organization millions.

A brief Q&A with Thierry Sebton of Accola

On January 1, 2019, a new framework for European securitizations took effect. This article reviews the options issuers should consider on trade receivables securitization following the prudential rules (1/1/2019). These include obtaining simple, transparent and standardized (STS) status and program funding options. Selecting a banking partner is therefore particularly complex.

Read on as Matthieu Guillot, Senior Director at Redbridge, and Thierry Sebton, Managing Partner at Accola, discuss the recent changes in the trade receivables securitization market.

What trends have you seen in the trade receivables securitization market?

Trade receivables securitization recorded sustained activity over the past six months. New issuers are entering the market, both from the post-2008 financial crisis program renewal and new entrants. Major players in the commodity trading sector are taking note.

Securitization is less expensive than unsecured financing. The benefits are manifold. Companies can finance diversification and optimize balance sheets and financial ratios. Furthermore, organizations can choose to distribute ancillary business to competent customer-driven banks. Also popular is the deconsolidation aspect of financing in conjunction with International Financial Reporting Standards (IFRS).

Companies owned by private equity funds tend to focus on maximizing the amount of securitization, resulting in a lower price sensitivity relative to other issuers. Conversely, cross-over borrowers seek optimized financial conditions — and possibly deconsolidation — to manage their ratios. To each their own.

How are the conditions evolving when it comes to program maturity and pricing?

The programs, which were traditionally five years in length, generally had one-year liquidity lines. Since the 2008 crisis, issuers have demonstrated an interest in structuring liquidity lines with maturities of over one year. Issuers now have negotiating power with the newly created variable renewal mechanisms.

Securitization continues to be a very competitive form of financing, in spite of changes to capital costs for banks after January 1, 2019.

Can you tell us more about the consequences of the new prudential treatment of securitizations?

The new prudential regulation is making the situation more complex.

First, it favors transactions that will benefit from STS status. This acronym stands for “simple, transparent and standardized,” and investors view it as a certificate of quality. To obtain STS status, issuers must meet three requirements: provide sufficient historical data, ensure receivables meet specific criteria, and disclose information based on the method of financing.

Importantly, the assignor must pay an external certifier along with the various parties involved in the creation of the program. This is a worthwhile investment because STS commands significant savings.

More complex regulatory capital costs for banks came into effect after January 1, 2019. These costs vary widely depending on whether the program is an asset-backed commercial paper (ABCP) program or not.

While the STS status is important, issuers should consider program funding structure. For example, “STS ABCP” vs. “STS non-ABCP” is not related to the characteristics of the receivables, but to the program’s refinancing method. ABCP programs are mostly funded via commercial paper.

Post-2008, regulators aimed to make positive changes. Unfortunately, 10 years later, these changes are unnecessarily complicated. The provisions appear arbitrary and the distortions are significant. This is a stressful atmosphere for banks — the latest regulations to be implemented on January 1, 2019, came out during…Q1 2019!

During recent offers, we observed bank difficulties in interpreting the new guidelines on regulatory capital. For the same bank, the margin for a non-STS was twice that of an STS program! The introduction of these new securitization options — non-STS, STS ABCP, and STS non-ABCP — makes choosing a banking partner even more complex.

With this complexity, is receivables securitization losing its favorable competitive status?

Absolutely not — receivables securitization is still relevant! The formula for implementation is just more complex than in 2018.

Banks are still in the process of digesting the regulations. The European Securities and Markets Authorities (ESMA) only published the new rules in February. We anticipate further clarifications throughout the year as groups report uncertainties about interpretation.

HAVE A QUESTION? CONTACT US

While credit rating agencies have not yet changed their central scenarios for credit default rates, they appear to be growing more nervous in the face of changes in the economic cycle and the resurgence of volatility against a backdrop of greater geopolitical uncertainty.

Sectors that are particularly sensitive to “macro” changes (e.g., consumer goods and services, foodservice distributors), as well as the oil sector, have already suffered from this.

The ratio of rating downgrades to upgrades is at its highest in three years. For example, Standard & Poor’s (S&P) rating downgrade ratio reached 72% at the end of the first quarter in 2019, meaning that downgrades represented 72% of the agency’s total rating actions.

Graph showing global corporate rating actions: investment grade vs speculative grade

Unsurprisingly, the credits considered the most fragile are the most affected. The most heavily indebted issuers have been under increased scrutiny for several months. Lower B-rated issuers are facing increasing pressure on operational performance, especially on free cash flows.

The graph below, based on U.S. issuers with a B3 rating, illustrates this trend, which is mainly affected by the increasing weight of leveraged buyouts (LBOs) in this rating category.

Line graph showing b3 debt levels’ growth

In this context, Moody’s appears more cautious than S&P. For several months, Moody’s has taken a more negative approach than S&P in the heavily indebted issuer segment. The agency tends to organize committees as soon as it notices a deviation from the initial scenario.

Similarly, if free cash flows appear low, Moody’s is not inclined to include in its analysis new management initiatives (i.e., reorganization, disposals) whose benefits will only be felt in the medium term. S&P seems to be giving management teams the benefit of the doubt and granting them more time.

Redbridge believes that split ratings between agencies could increase. For example, based on a global, non-representative sample of 900 issuers in the BB-/B- category, Moody’s rates one-third of issuers more severely than S&P and gives the same rating as its counterpart to 55% of issuers.

B-rated issuers must manage their ratings with the greatest care. This involves:

  • Understanding how rating agencies perceive their industry.
  • Proactively identifying potential challenges (e.g., ratio adjustments, generation of free cash flows after restructuring costs).
  • Building a relationship based on trust with rating agencies.
  • Considering a third rating.

If you have any questions, please feel free to contact us at 346 207-0250.

Following pressure from the European Commission, Visa and Mastercard pledged last year to cut their European interregional multilateral interchange fees by at least 40%. The two international networks will honor their commitment on October 19, 2019, according to banking sources.

This change will significantly reduce the costs for European merchants accepting consumer credit or debit cards issued outside of the European Economic Area (EEA). An example of this type of transaction is an American tourist dining at a restaurant in Belgium.

Specifically, the interchange fees for:

  • In-store purchases will be lowered to 0.2% for debit cards and to 0.3% for credit cards.
  • Online purchases will be lowered to 1.15% for debit cards and to 1.5% for credit cards.

This is excellent news for businesses such as luxury retailers, air carriers and other travel and tourism organizations, whose non-European customers account for a considerable portion of their revenue in Europe.

To help you better understand the current and future issues surrounding interchange fees in Europe and how they can impact your business, we have produced a PDF illustrating these changes.

If you have any questions, please feel free to contact us at 346 207-0250.

Data for Stronger Banking Relationships

Select your location