Key takeaways from our educational session at AFP 2019
Digital data was birthed with the creation of the computer in the 1970s yet has turned into a monster all on its own. The applications of this unnatural resource are just beginning to be tapped and are all the rage. How can treasurers harness this data and refine it in a way that will provide value? Let’s start at the source.
Treasury data comes from two sources: your internal organization and the banks. While you can control the format, consistency, and integrity of the data produced from within your organization, it is much more difficult to harness the moving target of data provided by your banks.
Thanks to widely accepted standards in file formats within the U.S., files of data that report the flows of money to and from the banks are widely used to perform cash forecasting, cash management, investment, and accounting functions.
Tapping into your bank fee data
In my recent presentation at AFP 2019 in Boston, we discussed the forgotten stepchild of data sources from your banks: bank fee statements.
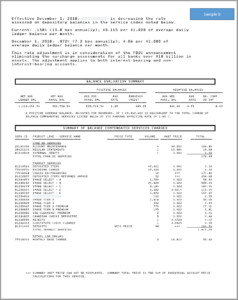
Those awful PDFs, CSVs, or even EDI messages containing cryptic service descriptions (not even understandable by most bankers) contain a wealth of opportunity to charter new territory and learn something about your organization.
Classifying your data
While the collection of statement data is straightforward in the U.S. compared to the rest of the world, preparing the data to be useful is an enormous challenge. The classification of the data elements is key to the success of any analytics. And anyone willing to sell you a tool (BIs are all the rage) without providing a real solution for how you are to classify and maintain the classifications of bank fee data clearly misses the point.
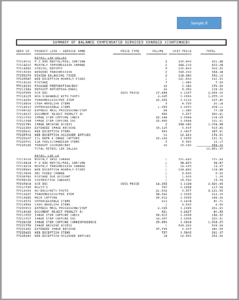
The AFP Service Codes have been around for years and offer a good solution for receiving nice, clean, classified data – if only the banks would assign their own services correctly. Members from American National Insurance Company co-presented with me at the national conference. We reviewed the AFP mapping of their services charged by banks within the U.S.
Here’s what we found:
- 58% of American National’s 398 services required mapping or remapping
- Two banks provided no AFP Codes on the statements at all
- One bank provided CSVs, others were PDFs that were unable to be converted
The bottom line is that to tap into your bank fee data, you must classify your data, and unfortunately, it’s not a one-time exercise. Most companies place the burden of this classification on a young treasury analyst within their team. I know because I was given this task in my first treasury job and I was lost. Twenty years later and I have mapped more than 35,000 bank services but I am still learning and struggle with deciphering the cryptic names of cash management services. It is worth it, however.
Why it’s worth the investment
Tapping into the resource of bank fee data and turning it into analytics allows you to answer six key questions:
- Where do I have bank accounts, and what does my banking landscape look like globally?
Aggregating bank fee data from domestic and international banks (yes, it is possible!) provides a risk management layer to confirm you are not paying fees on accounts that should have been closed. - What amount of the global bank fee budget should I allocate to my different business units?
Tagging fees by company, legal entity, or even general ledger code can easily help your cost allocation needs. - What should I budget for bank fees? How do I forecast this budget with an upcoming sale/acquisition?
Knowing what a particular business unit paid for fees historically will help you forecast changes for the future. Understanding your current costs by payment type allows you to build models to quantify costs and savings for proposed initiatives. - Who should I give this new cash management business to?
This is the fundamental question every CFO asks of a treasury team when multiple banks are involved! Knowing the cost per item of each payment type across each bank allows you to answer that question with confidence. - Is my treasury team performing the way they should?
The newest application for bank fee data is in internal team performance metrics. As treasury operations are managed by group treasurers in all parts of the world, having easy access to key performance indicators (punitive, manual, or extra charges incurred by treasury center) is a highly effective way to 1) identify areas where additional training may be needed and 2) monitor the performance of regional and offshore treasury centers. - We have an internal initiative to move away from checks. How much do we spend on check processing, and what will we save by moving to ACH?
Monitoring volumes of checks and ACH payments over time will demonstrate and quantify the savings of internal initiatives.
MANAGING BANK FEES A PAIN?
American National Insurance recently embarked on a project with Redbridge to dive into their data and produce analytics:
“We attended training sessions in the past to try to understand AFP Codes and perform our own classifications but found the exercise overly complicated. Finding a partner who had the expertise to perform this classification and maintain it for us over time was a big part of our decision to work with Redbridge to help us understand our fees and use their software for management reporting.”
Schedule a demo of our Hawkeye software solutions today.