The vast majority of Fortune 100 companies, if not all, utilize the public markets for raising capital funding through alternative sources rather than utilizing only banks for raising needed capital. In the Fortune 101 to 929, the majority utilize banks as their capital funding sources, reveals a in-depth study of the debt structure of Fortune 1000 conducted by Redbridge.
Key Findings of the Survey: Financing Instrument usage
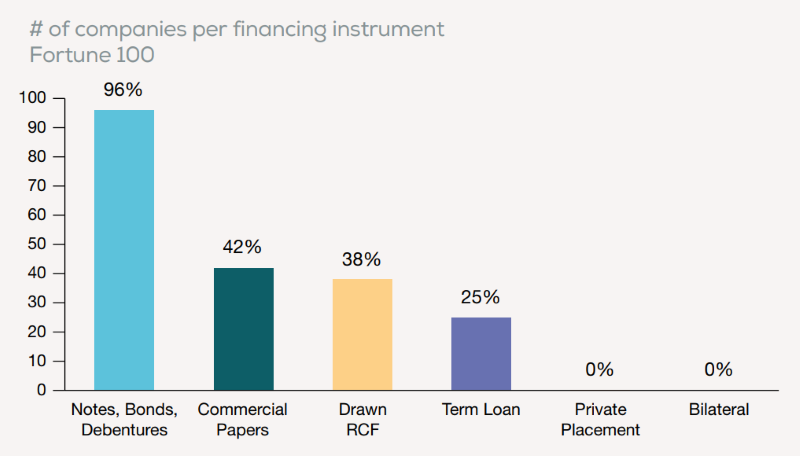
- Comparing Fortune 100 companies to smaller companies in the next two tiers, of the Fortune 100 companies, none use Private Placements, while between 3% and 7% of Fortune 101- 929 use them.
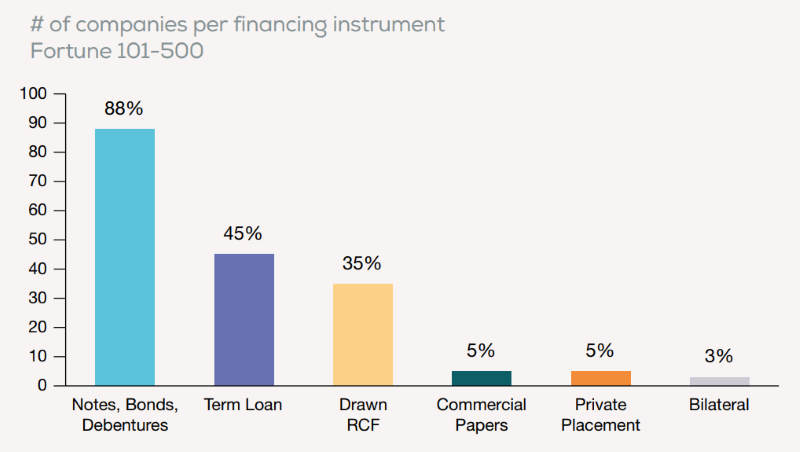
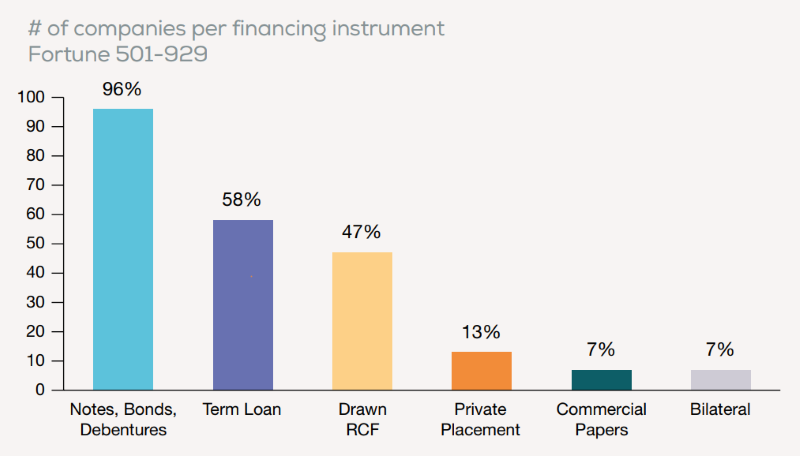
- Of the smaller companies in the Fortune 501 to 929, 58% utilize term loans compared to between 42% and 45% of the Fortune 500 companies.
Of the companies drawing down on their Revolving Credit Facilities, 47% of the Fortune 501 to 929 draw down on RCFs, but only 37% of the larger Fortune 500 draw down on their RCFs.
Key Findings of the Survey: Frequency of instrument usage by numbers of instances
- There is a dramatic drop in usage from 42% of Commercial Paper issuance from Fortune 100 to smaller companies in the Fortune 101 to 929 groups.
- Private Placements are not used by Fortune 100 but increasingly are used by 5% of Fortune 101 to 500 and by 13% of companies 501 to 929.
- Likewise, Factoring is not used by Fortune 100 companies but increases to 12% and 24% in the Fortune 101 to 500 and Fortune 501 to 929 groups.
- Letters of Credit are utilized by 38% of Fortune 100 but jumps to being used by 78% of Fortune 101 to 929 companies.
- Term loans are used by only 25% of Fortune 100 companies while used by 45% of Fortune 101 to 500 and used by almost 60% of Fortune 501-929 companies.
Key Findings of the Survey: Dollar Value of Instrument Utilization
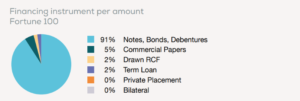
- Of the Fortune 100 companies, over 95% of their financings are in Notes, Bonds and Debentures and only 2% in term loans.
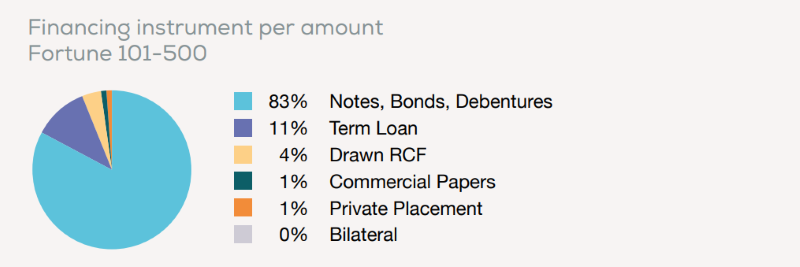
- Of the Fortune 101 to 500, use of Notes, Bonds and Debentures drops down to 83%, but with over 10% in use of term loans and 4% in use of RCF Drawdowns.
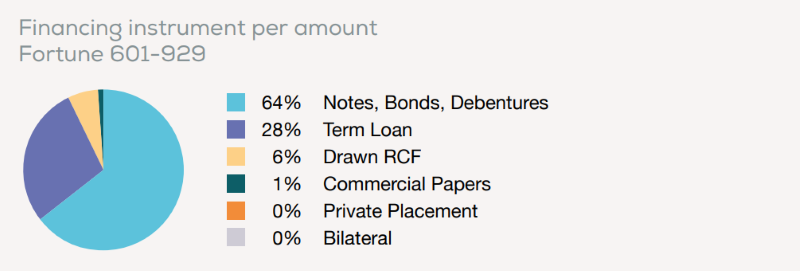
For the smaller companies in the Fortune 501 to 929, use of Notes Bonds and Debentures drops to under 65% and an increase in the use of term loans to 28%, and likewise an increase to 6% in the use of RCF Drawdowns with the smaller companies.
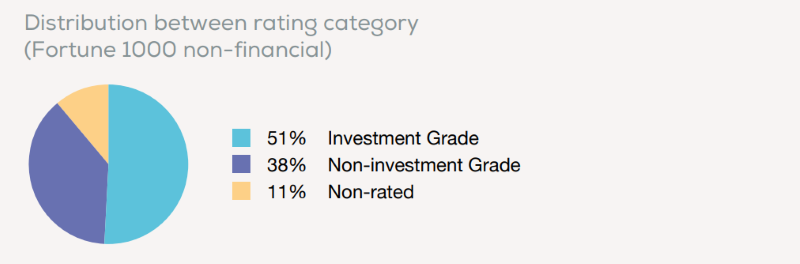
Key Findings of the Survey: Distribution between company ratings, and rated or not rated
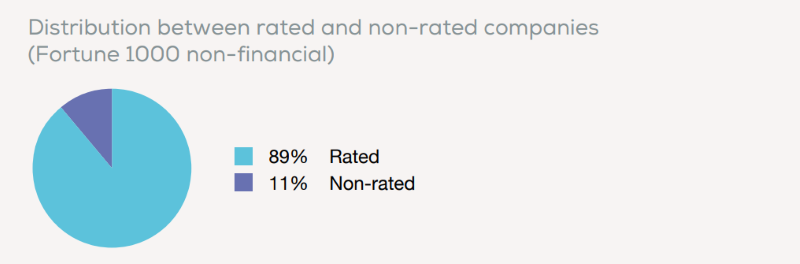
- Of all Fortune 1000 companies studied, 11% are not rated.
- Of those same 1000, slightly over half, or 51%, are rated ‘investment grade’ and 38% are rated ‘non-investment grade’.
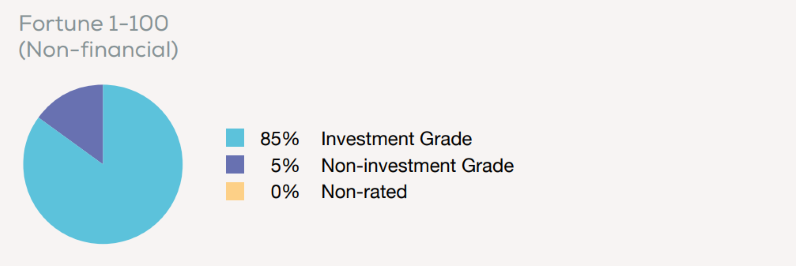
- Of the largest Fortune 100 companies, 85% are investment grade and 15% are non-investment grade. None of the Fortune 100 are non-rated companies.
- Of the Fortune 101 to 500 companies, 58% are investment grade, 35% are non-investment grade, and 7% are non-rated companies.
- Of the Fortune 501 to 929 companies, 36% are investment grade, 47% are non-investment grade, and 17% are non-rated companies.


Key Findings of the Survey: Company Location by State
- Of all the Fortune 1000 companies, the top 6 state locations having over 40 company headquarters include, in order of number of companies, Texas with 110, California with 108, New York with 70, Illinois with 60, Ohio with 50 and Pennsylvania with 45. The top 2 both have over 100 company headquarters, by far higher than even New York, in 3rd
- The same distribution holds true in Revenue-by-state of the Fortune 1000, except there are three states that, although they do not have a large number of company headquarters, the company revenues are among the top 8 states, with excess of $600 Billion in each: Michigan, Washington, and Arkansas.
- Of the largest Fortune 100 state locations, Texas, California, Illinois, and New York enjoy the most Fortune 100 company headquarters.
- Of the Fortune 101 to 500, Texas, New York, Florida and Virginia enjoy the highest number of headquarters.
Of the Fortune 501 to 929, California, Illinois, Ohio, North Carolina and Florida enjoy the most, but California and Illinois, by far, enjoy the highest number of headquarters.
Key Issues – Rigorous financing policies require several key elements
- an optimally sized debt structure
- multiple funding sources
- flexibility at the lowest possible cost
How Redbridge Can Help You?
- At a time when credit markets are undergoing profound structural changes, Redbridge’s debt advisory team provides its clients with a clear vision of all their financing challenges– and opportunities.
- analysis of the company’s financing needs, in line with its development plan
- analysis of banking relationships, based on a proprietary calculation model
- credit risk positioning strategy in relation to banks, rating agencies, and investors
Methodology
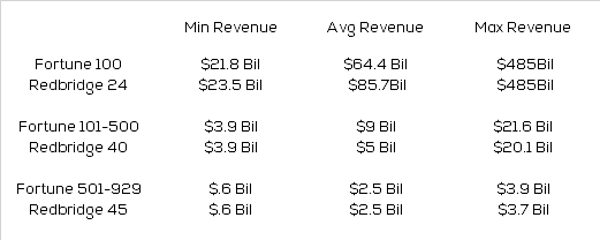
Redbridge DTA has conducted a random survey of 110 companies in the Fortune 1000, representing about 12% of the total 929 companies, in the Fortune 1000, not including any financial services companies.
Those 929 have total combined sales of $11 Trillion, $1.89 Trillion in EBITDA, $5.2 Trillion in debt, and $1.85 Trillion in cash or cash equivalents.
Redbridge’s random sample of 11% of the Fortune 1000 include:
- 24 companies in the Fortune 100,
- 40 companies in the Fortune 101-500,
- 45 companies in the Fortune 501-929.
The revenue profiles of the average companies in the Fortune 1000 compared to the Redbridge Sample; are statistically similar.